|
Buggy Lab ( 3 ways )
9/18/18 By: Cc Larrazabal, Kathleen Boyce, Alina Wang Applies to all three: How is the position of the buggy affected by time increasing? Independent variable: time Dependent variable: position of buggy Constants: buggy, ramp, stopwatch, motion detector Stopwatch Method: First, place buggy on ramp and measure where the front of the buggy stops. Second, start buggy and timer at same time and stop both simultaneously at 0.5 seconds. Third, to create repeated trials repeat these steps twice more to have 3 data points for 0.5 seconds. Lastly, keep doing this process until you have 10 data points with the highest as 5 seconds. Procedure: Took measurements with repeated trials for 10 different data points with a range of 0.5 - 5 seconds. Recorded Data: 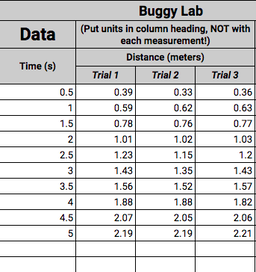
|
|
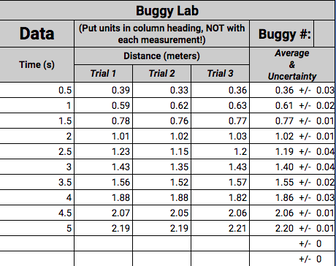
Processed Raw Data: Once we acquired all the data points including repeated trials for each, we average the three points together. This allows us to get the most accurate point for the graph since we all walk at very different speeds.
GRAPH
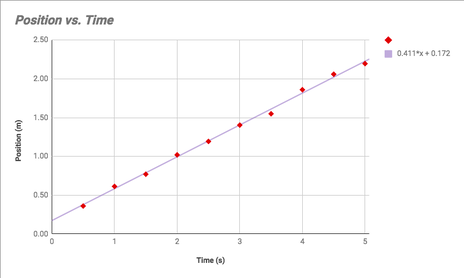
Equation: ( y = mx +b )
Position (m) = 0.411ms^t + .72m
Equation: ( y = mx +b )
Position (m) = 0.411ms^t + .72m
Motion Detector
Method: First, place motion detector at the end of the ramp and connect it to a computer. Next, start buggy and measure 10 data points in the range of 0.5-5 seconds.
Procedure: We connected the motion detector to a computer and measured all 10 data points.
Recorded Data:
Method: First, place motion detector at the end of the ramp and connect it to a computer. Next, start buggy and measure 10 data points in the range of 0.5-5 seconds.
Procedure: We connected the motion detector to a computer and measured all 10 data points.
Recorded Data:
|
|
|
|
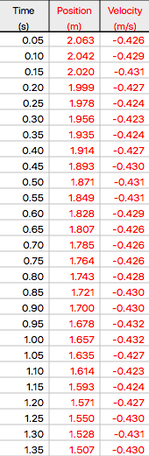
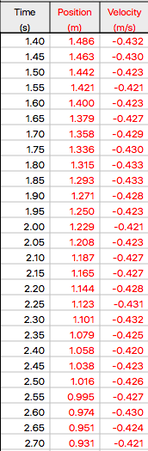
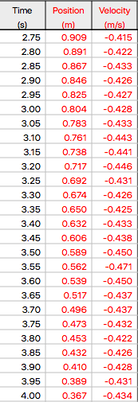
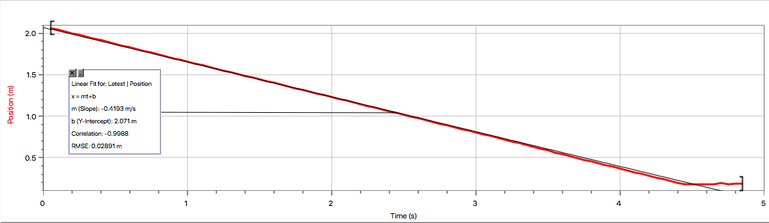
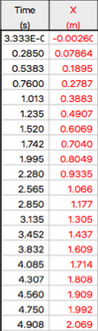
Processed Raw Data: Once we acquired all the data we made our graph with the x axis being time and the y axis is position.
GRAPH
Equation: ( y = mx +b )
Position (m) = -0.4193ms^t + 2.071m
GRAPH
Equation: ( y = mx +b )
Position (m) = -0.4193ms^t + 2.071m
Video Analysis
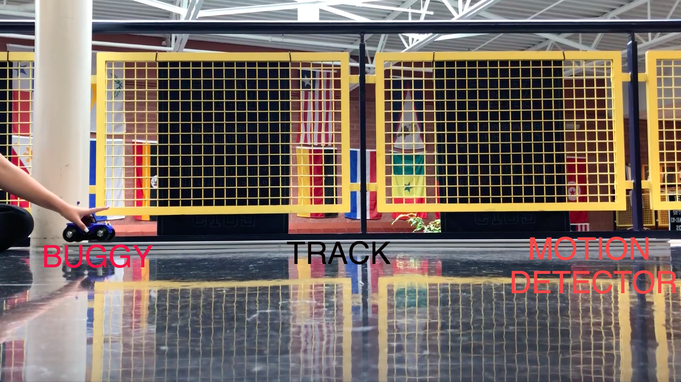
Method: Set up the buggy at the start of the ramp. Next get you camera to take the video far enough away to see the entire track and make sure the phone is set down so it doesn’t move. Lastly, start the video and the buggy and record until the buggy reaches the end of the track.
Procedure: We set up the camera, recorded the video, and found the points from our video.
Recorded Data: Our recorded data is the video we took during the lab.( The video is linked below )
| Buggy Lab Video Analysis |
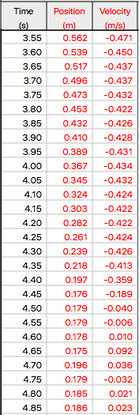
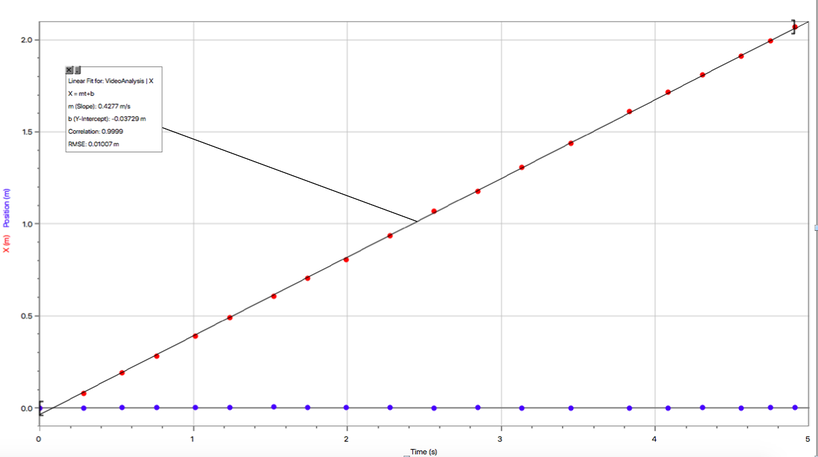
Processed Raw Data: Once we created the video we were able to actually do the video analysis by importing the video and finding the points from the video to create and chart and graph. ( chart on the left )
GRAPH ( on the right )
Equation: ( y = mx + b )
Position (m) = 0.4277ms^t - 0.03729m
GRAPH ( on the right )
Equation: ( y = mx + b )
Position (m) = 0.4277ms^t - 0.03729m
|
|
All Three:
Conclusion
Through this lab we were able to observe the differences between taking measurements three different ways for the same lab. Each of the three experiments ended with very similar slopes other then then the motion detectors slope being negative because the cart was traveling towards the sensor. The y intercepts however all differed, the video analysis and stopwatch should have both been zero and the motion detector should have been 2.275. All of the graphs were linear as well due to the constant velocity. Two of the graphs were positive, but the motion detector had a negative slope due to its location at the end of the ramp. All three of the ways to take measurements work efficiently and get correct data points and graphs, however I believe the video analysis method allows the most points and the most accurate data due to the video being pre taken and being able to make sure all the points are together and at the right point.
Uncertainties: There a couple uncertainties throughout this experiment. One was that the buggy would sometimes go at different speeds so we didn't necessarily know if the buggy was traveling at the same speed as the other trials. There was also a uncertainty through setting the buggy down for each trial and whether it started at the same place every time. There was also a uncertainty to stop the timer and buggy at exactly the same time for the stopwatch since they both had to happen perfectly together very quickly.
Strengths: The motion detector was a strength because it was very easy to get the graph and data points correctly.
Weaknesses: The video analysis did work well but it was confusing for me at first to create the graph since I have never done it before.
Improvements: An improvement would be to try and and make the stop watch more accurate by maybe adding a timer sound to know exactly when to stop.
