Unit 0
Patterns and Measurement
9/10/18
Scientific notation is how you are able to write very large or very small numbers without writing out every digit. For example if you had a very large number like 750000000 you would move the decimal to where the number is not smaller than one but also not higher than 10. Finally you would write that number as 7.5 x 10^8. On the other hand if a number was very small like 0.00034 you would follow the same guidelines except now the power of 10 would be negative (3.4 x 10^ -4). On a calculator to do scientific notation you have to use the button “E” which stands for x10^ whatever power, except you should never actually write the E instead of x10 because it makes you look stupid. (0.01A) There are many simple ways to be able to convert units easily and quickly using math. In the picture below it shows the easiest way to do it between miles and feet, hours and minutes. The most important things to remember is to have the right conversion key, always cancel out units not used in final answer line everything up in the right spot for the answer so the units are not messed up. (0.02A) Linear graphs are one of the simpler graphs to comprehend. A linear graph is basically just a line, an infinite number of points between two points. The y intercept of a linear graph shows us what the dependent variable (dv) is when the independent variable (iv) is zero and the slope shows how the dv changes when the iv increases. (0.03A) Inverse and quadratic graphs can get a little more complex. The quadratic graph is a parabola, the slope of this graph is the same as the linear in the fact that it shows the dv’s changes as the iv increases except the slope looks different in some areas. The y intercept of the quadratic tells us the exact same thing as the linear y intercept. The inverse follows the exact same guidelines as the quadratic except the graph doesn’t always have a y intercept because it doesn’t always cross the y axis. (0.04B) When you are given a set of points you should graph all the data given and determine the line of best fit which will tell you what kind of graph it is, what the equation will look like, and of course the slope and y intercept. (0.05C) When you conduct an experiment make a graph there are many areas that could be an uncertainty of yours. Popular sources of uncertainty would be of course a human’s actual reaction time (ex: stopping a timer) and then the equipment can of course make mistakes as well. There are also 3 different ways to determine what your confidence level should be on a experiment; how much data you have (at least 5-10 item), how large your range is (largest should be 10x bigger than smallest), and how many trials were conducted (at least 3-5). (0.06C)
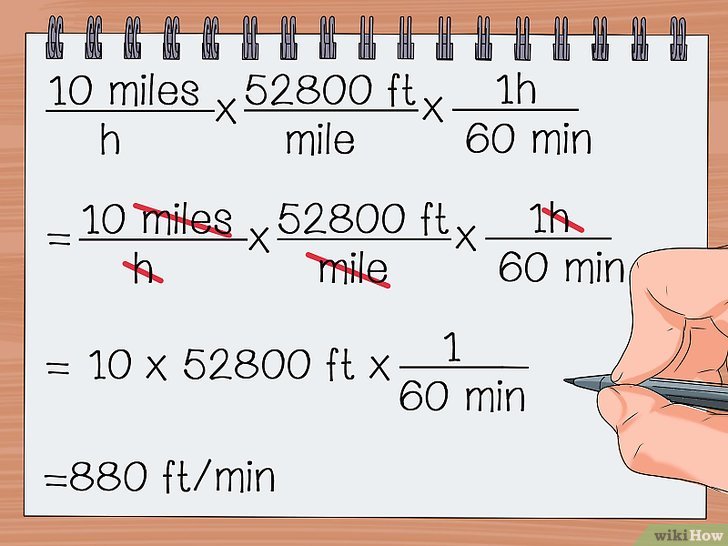
Image link: https://es.wikihow.com/convertir-unidades#/Imagen:Convert-Units-Step-14.jpg
